Welcome to the GrainStat.com blog! This is a special edition post where we take a first look at what is in store for planting prospects of US agricultural crops in 2023.
*Copyright notice: All works on this blog (blog.GrainStats.com) and the GrainStats.com domain are copyright protected and may not be duplicated, disseminated, or appropriated.
The Planted Acres of America🧑🏻🌾
Every year the United States Department of Agriculture (USDA) publishes crop planting estimates collected through a survey sent to US farmers by the National Agricultural Statistics Service (NASS).
Officially, the report is entitled the USDA Prospective Plantings report, but many in the trade will simply call it the “planting intentions” or “acreage” report for short.
(if you haven’t noticed by now, the trade loves to shorten as many terms as possible.)
In the report, USDA drills down state by state, the acres of each crop that have been planted, are expected to be planted, as well as several crops whose acres are reported as harvested or intended to be harvested.
The planting intentions report is widely watched by industry participants because it helps determine what the expected supply will be of a given crop. This in turn affects the price of the crop in question.
When planted acres reported fall short (less supply) of market expectations, prices tend to rise, while an excess of planted acres reported (more supply) relative to market expectations tends to lead to a decrease in prices for the crops in question.
Be aware, the planting intentions report released on March 31st every year is not the final number of acres that gets planted. Crops can fail, be replanted, or switched entirely to another crop where it makes sense to do so. That means that until the crop is harvested, the market won’t know the true supply for the season, but it can certainly attempt to do so using the futures market as a pricing mechanism.
US Planting Intentions🌽🌾🌱
Although the planting intentions report surveys over 20 crops, ranging from Potatoes🥔 to Tobacco🚬, the big crops get all of the attention.
How big?
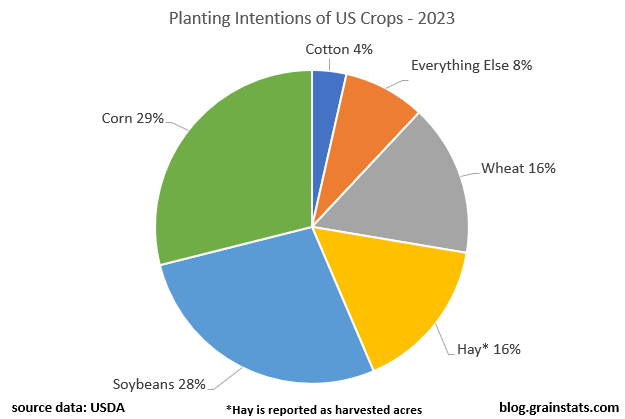
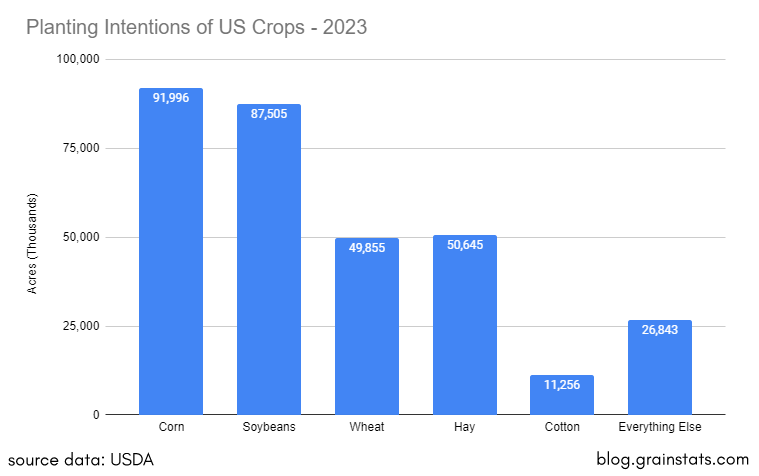
Of the +300 million acres that are expected to be planted or harvested, over half are used to cultivate the principal crops of the United States - Corn🌽 and Soybeans🌱
Are these figures impressive? Absolutely, and we’ll show you why.
But before we begin, we have to define our measuring tool👇🏻
What’s an Acre?🤔
I’m guessing most people don’t exactly know what an acre is, only what it represents - land. That is exactly true, even the Old English word, æcer, was defined as an “open field”.
However, open fields could be large or small, so what is the measurement definition?
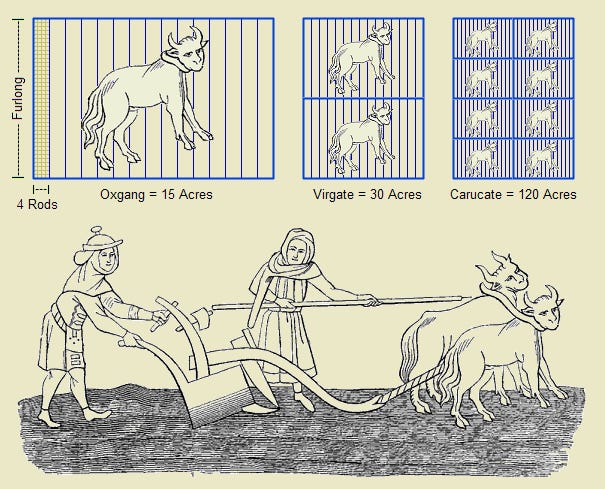
In a medieval text dating back to the 1200’s, an acre is defined as "40 perches [rods] in length and four in breadth”. Or simply, the amount of land tillable by one man behind one ox in one day. (Wikipedia)
I’m not sure about you but I never hand plowed a field with an ox ever in my life and don’t plan to, so let’s get with the times in defining what an acre is.
The hard and boring way to do so is just by telling you one acre is 43,560 square feet.
OR
We can use an acre in relation to something that already exists 🏈👇🏻
Basically, 75% of a US Football Field🏈 is one acre. This implies that Farmers in 2023 will plant crops on the equivalent of 240 million football fields, based on the planting intentions report.
Where do they plant it all?🗺️
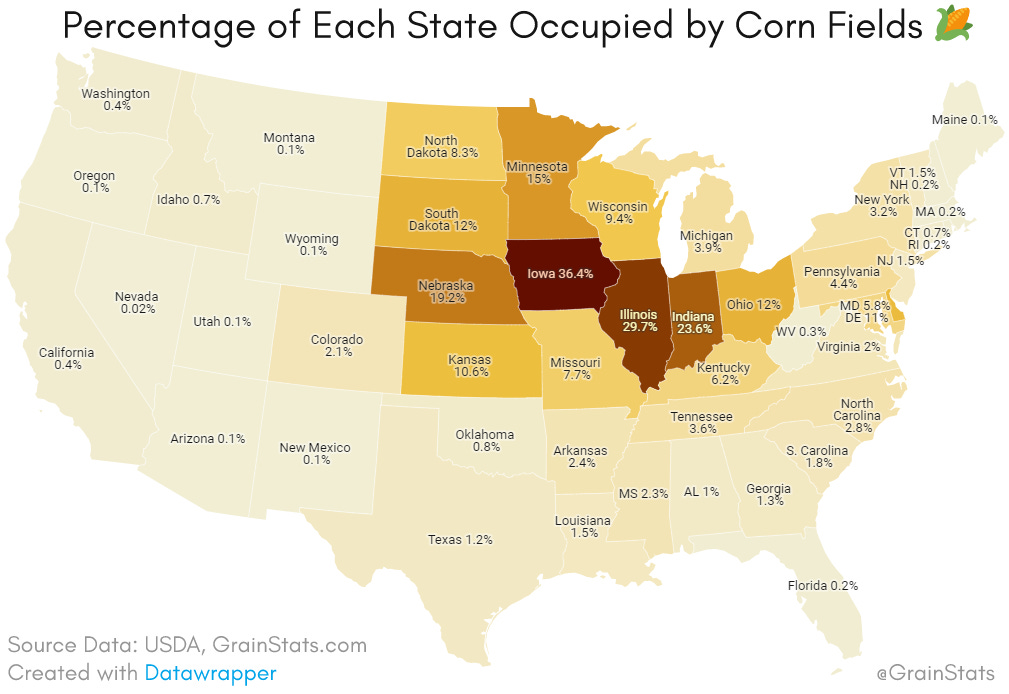
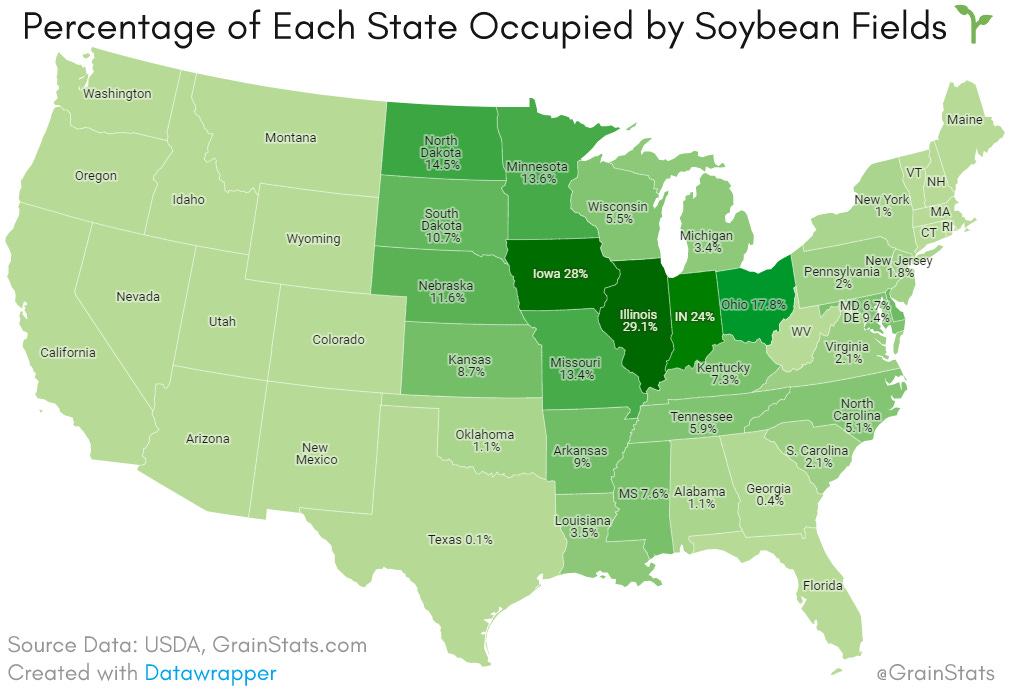
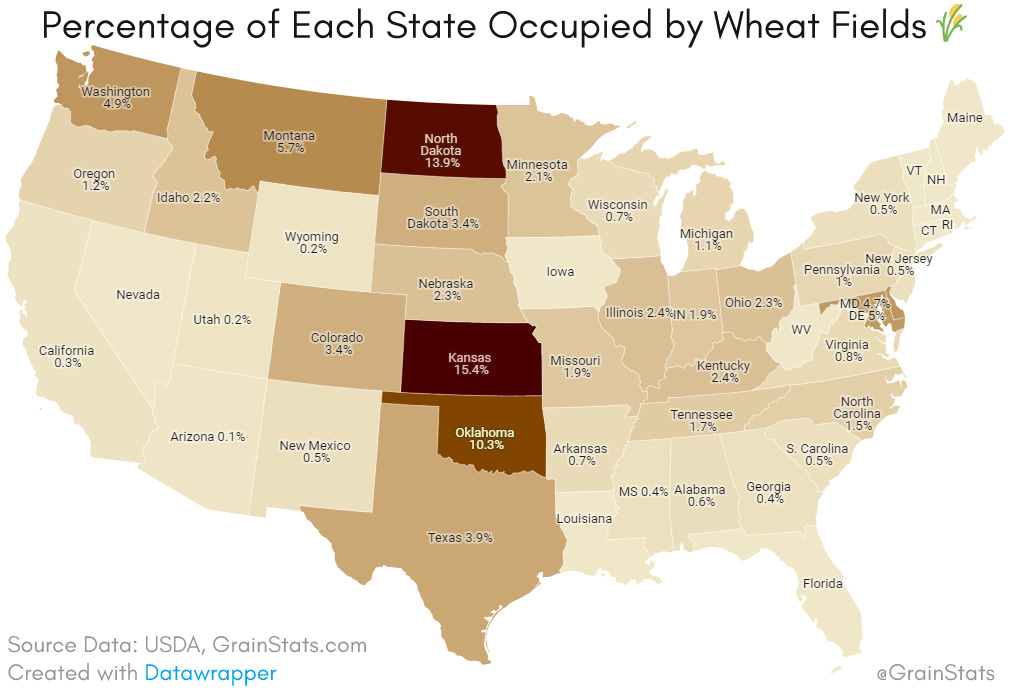
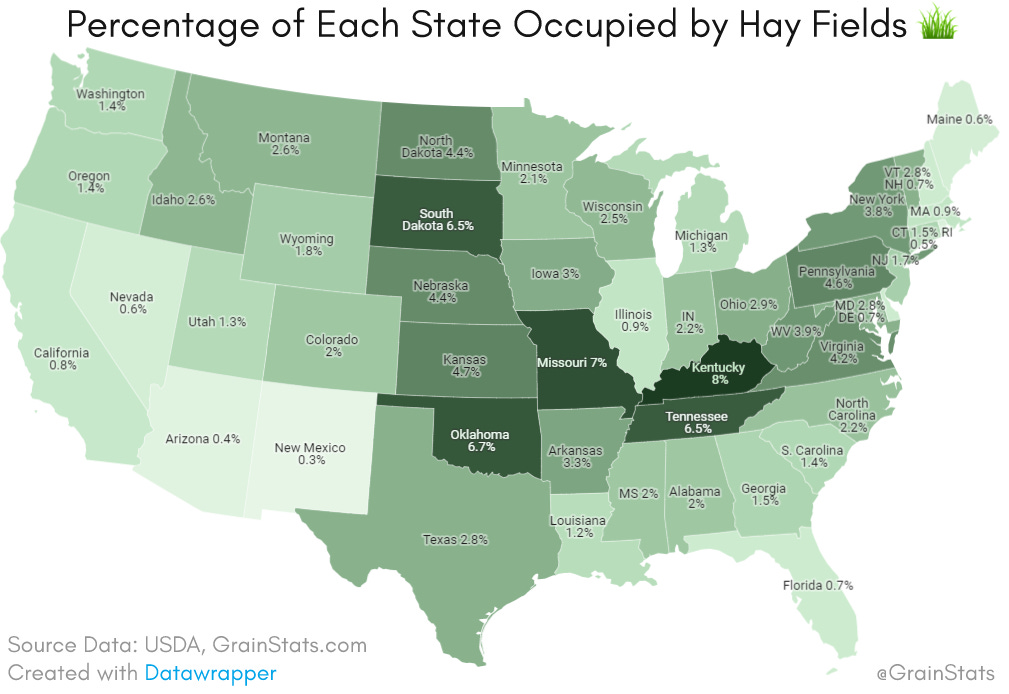
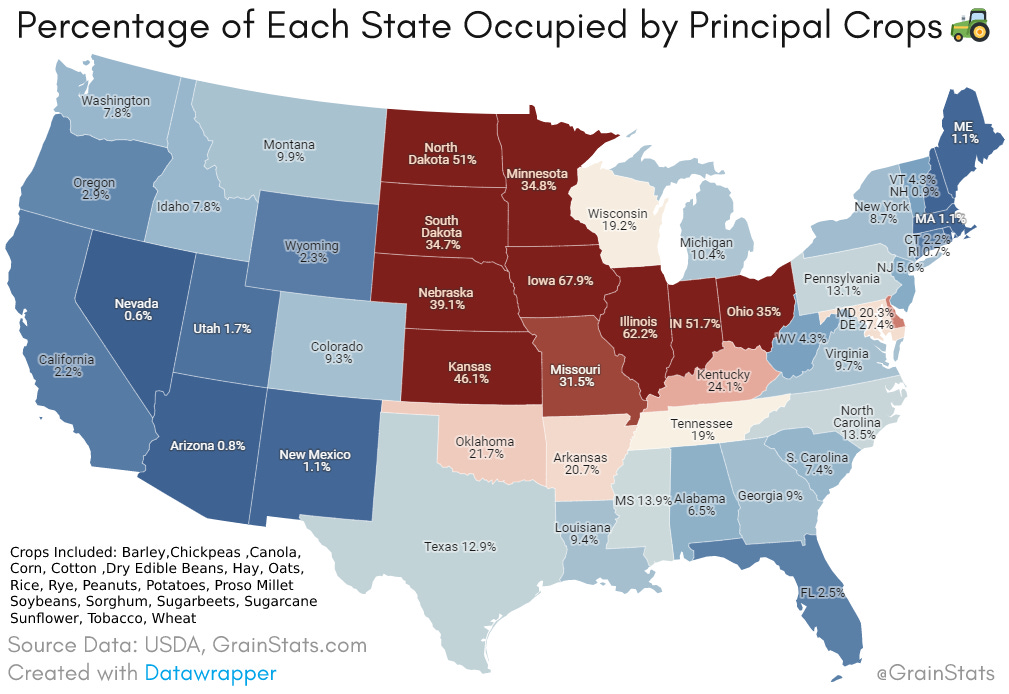
As mentioned previously, the planting intentions report breaks down the where crops will be planted, state by state. Using these data points, we can give an eye opening view of what the landscape of America really looks like 👇🏻
Corn🌽
⬆️Largest percent occupied: Iowa
⬇️Least percent occupied: Nevada
Soybeans🌱
⬆️Largest percent occupied: Illinois
⬇️Least percent occupied: Texas (of reported)
Wheat🌾
⬆️Largest percent occupied: Kansas
⬇️Least percent occupied: Arizona (of reported)
Hay🍀
⬆️Largest percent occupied: Kentucky
⬇️Least percent occupied: New Mexico
Cotton☁️
⬆️Largest percent occupied: Texas
⬇️Least percent occupied: California (of reported)
Principal Crops 🚜
⬆️Largest percent occupied: Iowa
⬇️Least percent occupied: Nevada
Closing Time⌛
We hope you enjoyed this post and hope it opened up your eyes to how impressively large the American agricultural landscape really is.
If you enjoy this type of content, subscribe to our blog and follow us on Twitter where we post grain market news, information, and analytics on a regular basis.


