Welcome to the Grain Trading Crash Course (GTCC). This is a free course presented by GrainStats.com for anyone who is interested in the grain markets. Whether you’re a seasoned pro or a newbie, there is something for you in this course. Feel free to share the knowledge gained from this series and pass it along to your students, friends, family, and co-workers.
*Copyright notice: All works on this blog (blog.GrainStats.com) and the GrainStats.com domain are copyright protected and may not be duplicated, disseminated, or appropriated.
Background ✅
This is the third installment of the futures component of the Grain Trading Crash course. In previous lessons we focused primarily on educating you how to read futures contracts and understand futures contract specifications.
Today we’re going to take what we’ve learned and take it a step further to present one of the most important topics surrounding the futures markets, the forward curve.
Money Talks 🫰🏻💹
When we talk about commodity prices we have a tendency to focus on what’s immediately in front of us. This is natural, we want to know the price performance of the commodity to help better understand what the supply and demand situation is and make a trading or marketing plan for the future.
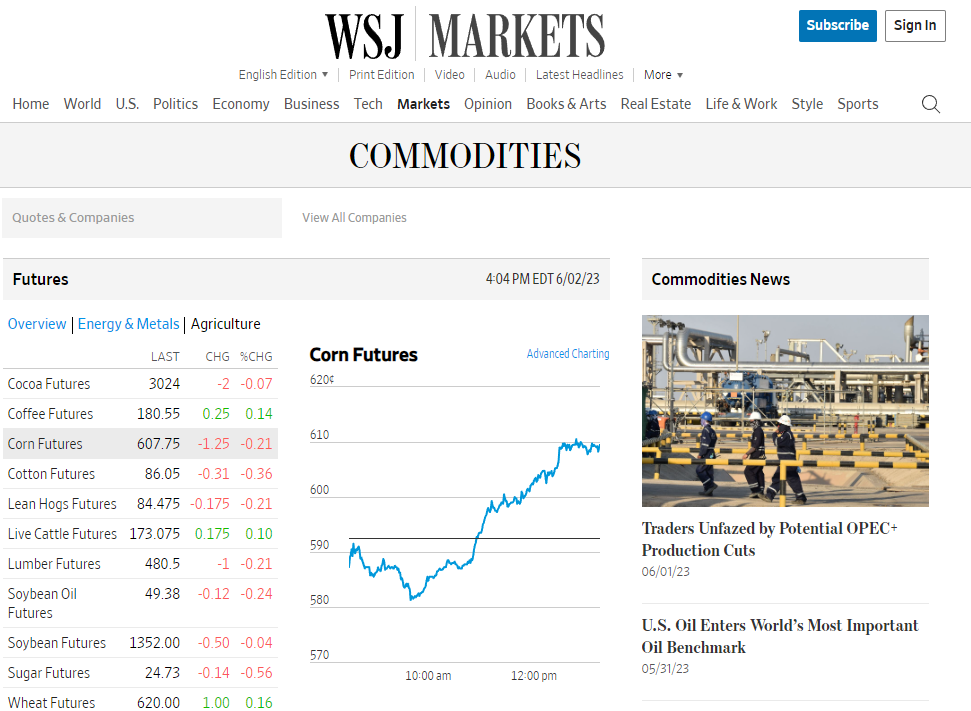
A perfect example of this is can be found in the commodities section of the Wall Street Journal 👇🏻
Notice under the Agriculture section that the prices of futures are displayed without knowledge of which contract is being referenced, but we can surely guess that it’s the nearby contract.
At the time of this writing the nearby futures contract for Corn, Soybeans, Soybean Oil, and Wheat futures is the July (N) contract.
Although the price performance of the nearby contract is important, it fails to describe what the overall supply and demand is of a given commodity. To understand what the supply and demand situation of a given commodity is, you have to look at the forward curve.
The Forward Curve🎢
The forward curve is simply the price relationship between different contracts months at a point in time. The prices could represent futures contracts or even physical forward contracts calling for delivery of a commodity.
The forward curve can also be referred to as the futures curve in the case of futures only contracts.
For the purpose of this lesson we will use forward curve and futures curve interchangeably.
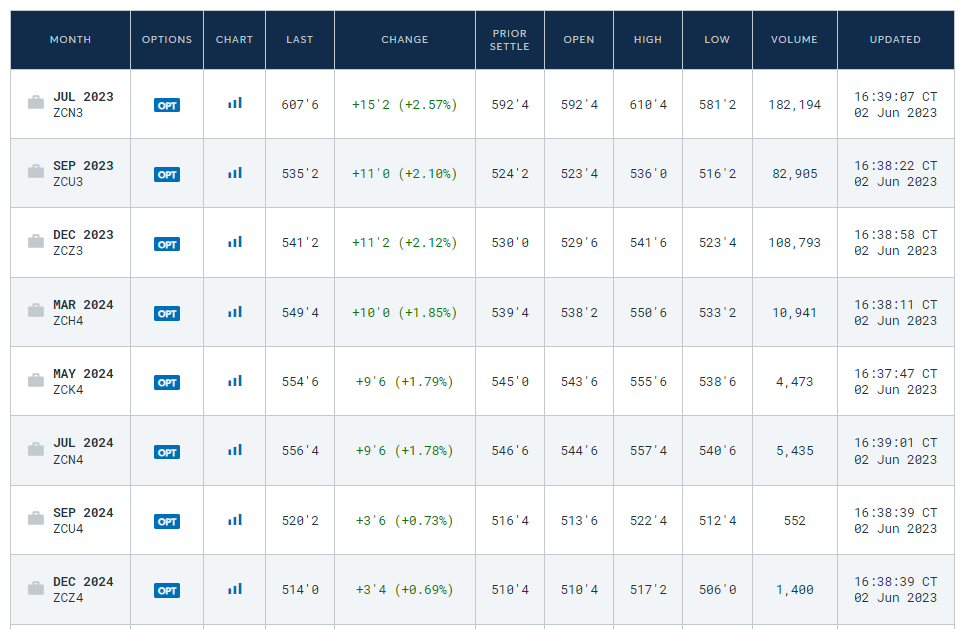
Take Corn🌽 futures for example. The below contracts are all active futures contracts that are trading on the Chicago Mercantile Exchange. Note the price disparities between the different months.
The nearby contract, July 2023, is priced at 607’6 ($6.0775 dollars/bushel)
The next contract, September 2023, is priced at 535’2 ($5.3525 dollars/bushel)
Thereafter, December 2023, is priced at 541’2 ($5.4125 dollars/bushel)
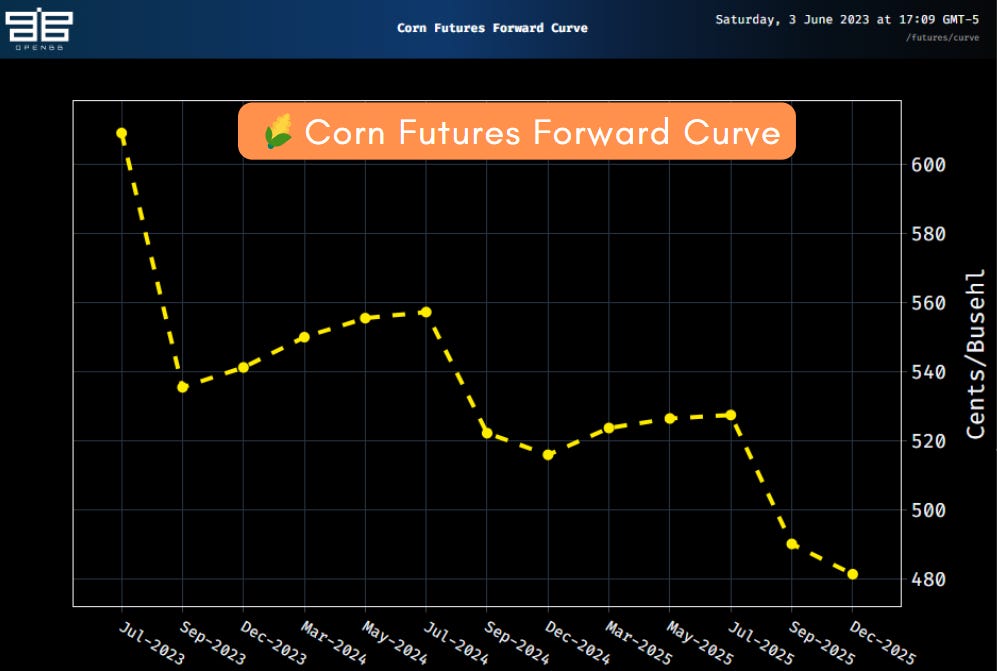
When plotting these prices on a chart, patterns emerge👇🏻
You might be already wondering, why are July futures higher than September futures, but September futures lower than December futures? The simple answer to that question is that the different contract months are implicitly pricing in the expected supply and demand of Corn between different maturity dates based on what is known today in conjunction with carrying costs.
The above statement is very dense for someone unfamiliar with commodities, so let’s step into it slowly.
The Inverse📉
Let’s start from the very beginning of the forward curve for Corn. As mentioned previously, July futures are higher than September futures. This pattern is also exhibited in 2024 and 2025 👇🏻
The pattern described above is called an inverse in the market, or an inverted market. This simply means that between two (or more) sequential contract months the first contract’s price is higher than the subsequent month(s).
Protip: An inverse or inverted market also goes by the name of normal backwardation, or a market in backwardation. Both inverse and backwardation are respected by commodity traders, but when it comes down to agricultural trading, stick with the term inverse.
Why do inverses occur?🤔
Inverses in the market appear whenever there is a dislocation in available inventories relative to demand. It’s the market’s way of saying,
We need Corn 🌽 now! And we're willing to pay more for it now!!!1To elaborate further, let’s go back to how we got to this point in the Corn market.
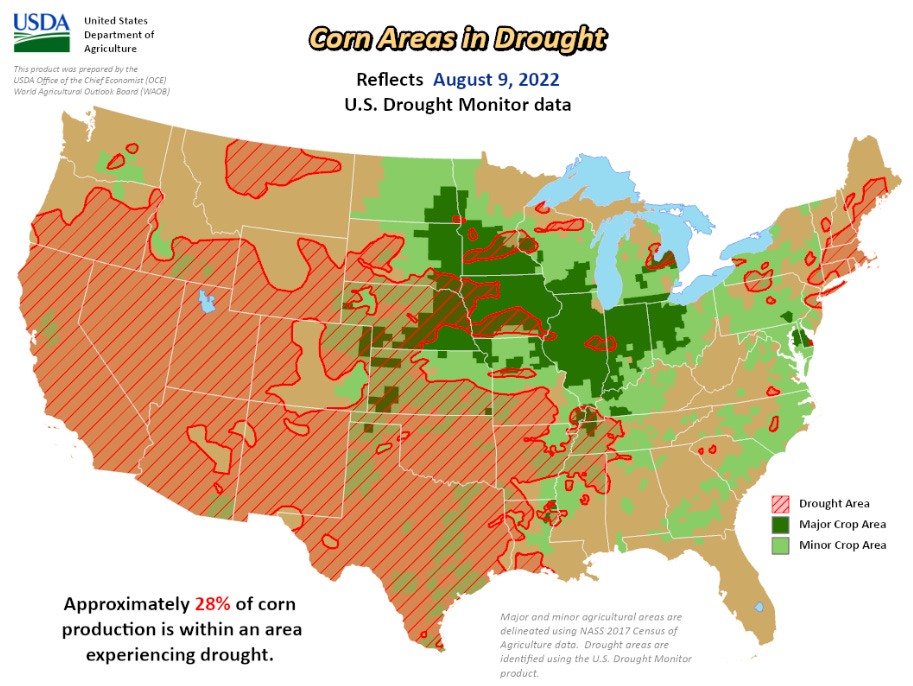
Last year the US started experiencing drought across many parts of the Western Corn Belt. This led to a reduction in production of the US Corn crop which in turn created a situation where available bushels of corn became more difficult to source than normal.
As the marketing year dragged on, the availability of physical corn bushels continued to drop, leading to the market pricing in tightness of available supply in the summer months as reflected in the July contract relative to the September and December months.
We are now in the final months of the marketing year and the market needs Corn now, not later, so the price of Corn has inverted versus the subsequent months when the market knows Corn inventories will be replenished with the annual fall harvest.
This inverted market structure translates to a strong sell signal for those who have the bushels on hand for the value of their bushels is expected to depreciate as new supply starts to enter the market.
It is important to note that inverses have no limit as they reflect scarcity pricing. This means the price can continue to rise versus the subsequent months until demand destruction of some form occurs. (e.g. A commodity processor shuts down due lack of profitability due to input costs of the commodity)
The Carry📈
The carry, also known as the cost of carry, is the opposite of an inverse, it’s when prices are higher in the subsequent months.
Protip: A carry or carry market also goes by the name of contango, or a market in contango. Both carry and contango are respected by commodity traders, but when it comes down to agricultural trading, stick with the term carry.
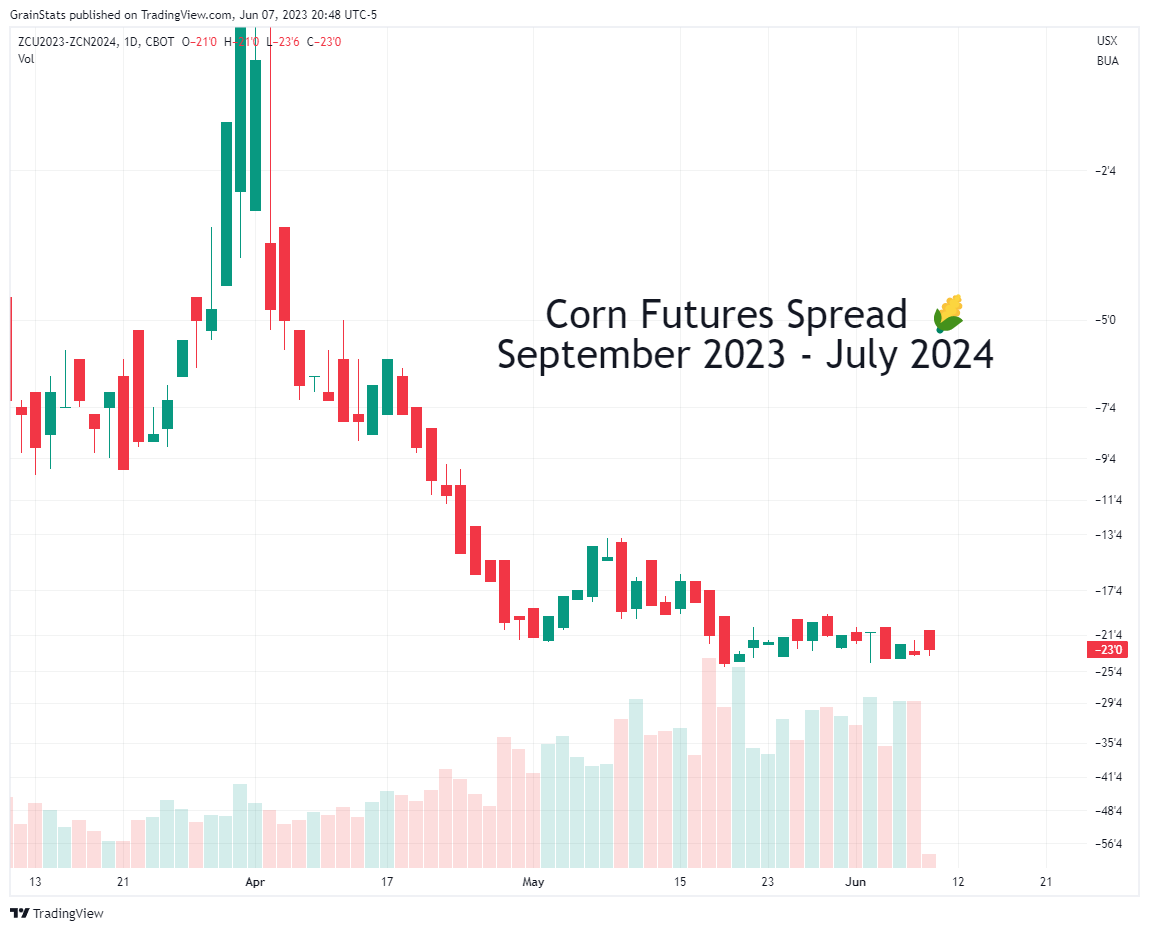
In the above chart there are two sections of the forward curve where a carry market has formed:
September 2023 to July 2024
September 2024 to July 2025
Is it odd that both carries start in September and end in July?
Not really, here’s why 👇🏻
Corn harvest in the US kicks off in September. This is when the maximum amount of corn will hit the market throughout the marketing year. All of this corn will have to go somewhere - fill grain bins, bags, grain piles, etc. This corn isn’t “free” to store and there is an ample amount of it hitting the market within a three month window.
So what does the market do?
It starts to price out what the carrying cost will be in the market. The carrying cost is the total cost of owning and storing the commodity and includes the financing costs to purchase the commodity, the actual storage cost at the facility, and insurance costs.
Carrying costs are not uniform across the corn belt either. The market will set the carry depending on the local supply and demand of that crop as well as other crops that compete for the same storage.
Take for instance the Chicago futures market. It is the most liquid corn market in the world. Currently it is implicitly setting the price of storage for a crop that hasn’t even been harvested 👇🏻
Compared to inverses which have no limits to how high they can go, carry markets have a “limit” to how wide they can get.
Take for instance the Chicago Corn futures contract, from the previous lesson we discussed what the storage rate is for Corn shipping certificates. This turns out to be around ~8 cents a month. If it so happens that the market is pricing in an unusually large carry greater than ~8 cents/month, a buyer could do the following:
Buy the nearby futures contract and sell a deferred futures contract
Wait and take delivery of Corn shipping certificates
Pay all applicable storage costs
Redeliver the Corn shipping certificates on the deferred futures contract
Realize profit
This is just a simple example of how to arbitrage the carry market, assuming your financing costs are zero or you have ample cash on hand. Of course not everyone has the cash on hand or can acquire cheap financing for this trade, but it demonstrates that it is possible to do so and that the upper limit of the carry is when arbitrageurs arbitrage the riskless carry from the market.💡
Closing Time⌛
This concludes Futures: Part III of the Grain Trading Crash Course. In the next lesson of this course, we will conclude the Futures education component with a few more contract terms and practical examples in the futures markets that you should be aware of. We know we mentioned this last time, but we did not expect this lesson on the forward curve to take up the entire lesson.🙃
We hope you enjoyed this lesson of the Grain Trading Crash Course. Remember to subscribe and leave a comment below if you enjoy the content we are providing to the community. Thank you! 🤠






Great stuff, really appreciate your work on this, please, keep going! :)
Well done commentary on the basics of agricultural spreads. Thank you for sharing